Q1 Brooklyn Industrial Market Update
Below, you’ll find an overview of the Brooklyn Industrial market in Q1 and some noteworthy insights. This data excludes transactions under $1m and self-storage transactions.

Transactions, Dollar Volume & Trends:
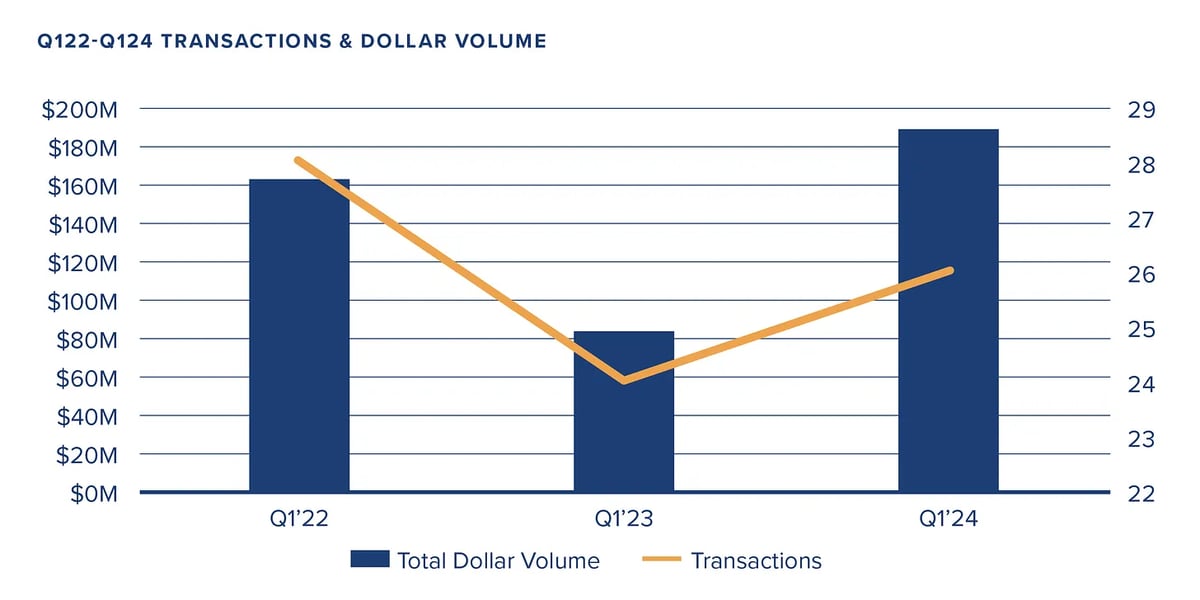
- Approximately $190M in total dollar volume, marking a 56% increase from Q123, and a 15% increase from Q122.
- 26 industrial transactions occurred in Q1, averaging $7.3M in sales price.
- Q1 saw 11 transactions above $5M, which is a huge increase from 5 in Q123.
- Warehouses over $5M traded at an average of $400 per SF, while those under $5M traded at a whopping $521 per SF.
- Buyer profile was comprised of 31% investors, 19% existing neighborhood owners, and 50% first-time buyers.

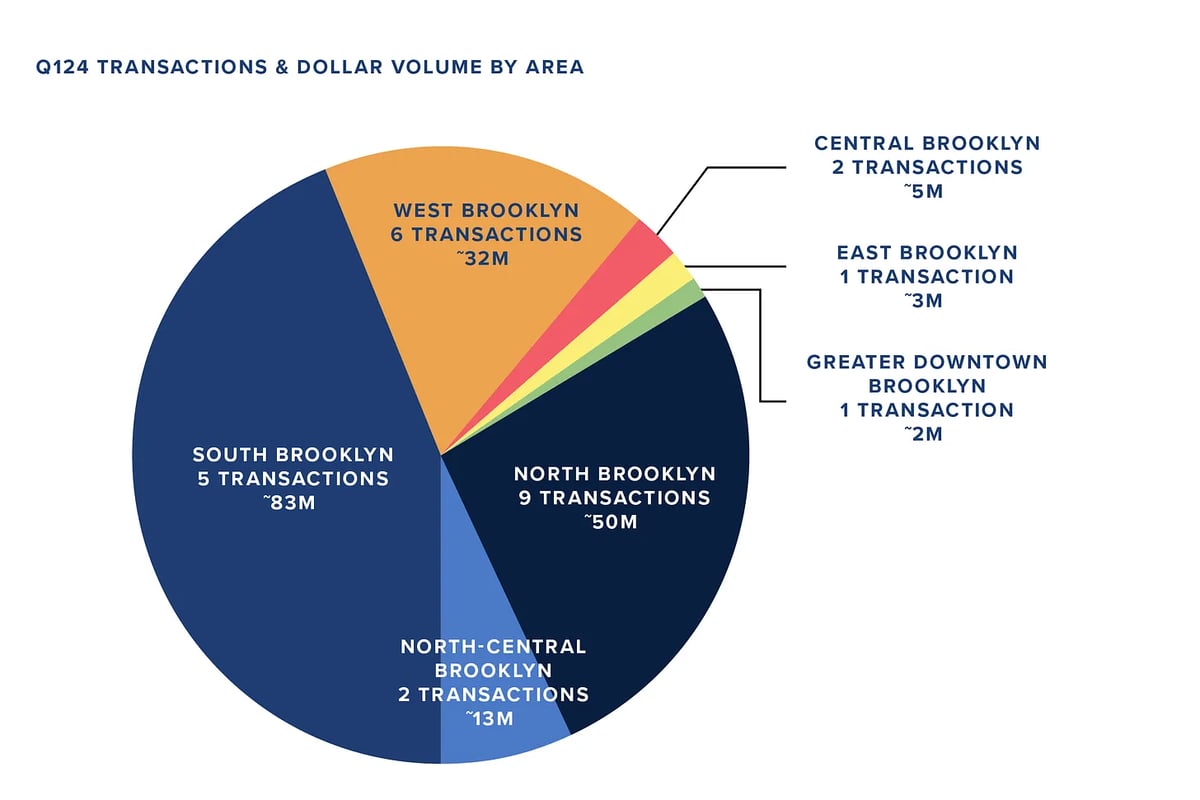
- South Brooklyn accounted for nearly 45% of total dollar volume in Brooklyn, with the most notable transaction being the sale of a 16-acre lot in Gravesend for a staggering $51 million.
- North Brooklyn led in transactional velocity with 9 transactions, closely trailed by West Brooklyn with 6 transactions.
Three Takeaways From Q1:
- Dollar Volume Rebound
Dollar volume serves as a barometer of institutional confidence in NYC and the economy. While uncertainties in the economy persist, stable interest rates over the past 7 months have allowed investors to be more confident in their underwriting facilitating larger transactions.
- User is King
Last year, 84% of the transactions were bought by users. In Q1 this trend continued with 69% of all transactions being bought by users. If you are a seller in today’s market, cooperation with brokers, exposure, and excellent marketing material has never been more important!
- The Buyer Pool Under $5M is Insatiable
We saw a sales price per SF record of $521 for deals under $5M. Service-based businesses continue to pay massive premiums for vacant warehouses and while that premium exists above $5M, it is not as strong as the sub-$5M market.


