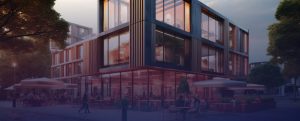
Cleveland East Side Multi-Tenant Market Report
Cleveland East Side Market Overview
Cleveland is located on the shores of Lake Erie and is known for its scenic beauty. Each of the included submarkets is situated on the East side, offering residents and visitors a perfect blend of small-town charm and easy access to the vibrant cultural and recreational offerings of the Greater Cleveland area.
The following submarkets are highlighted in this Cleveland East Side Multi-Tenant Market Report:
- Northeast
- East
- Chagrin Corridor
- Lyndhurst-Landerhaven
Highlights
- Northeast is the largest retail submarket in Cleveland, boasting a vast expanse of 27 million square feet in retail space and an overall asset valuation of $2.8 billion.
- General Retail is the most prominent subtype within the East retail submarket.
- In the past three years, the Chagrin Corridor retail cap rate has edged down to 8.0%.
- Within the Lyndhurst-Landerhaven retail submarket, Neighborhood Centers are the largest subtype, with 610,000 SF in this category.
Northeast
Vacancy | Rent | Construction | Sales
The Northeast retail submarket’s performance is aligned with the overall Cleveland market. The vacancy rate has shown a consistent decline over the past 10 years, with limited new retail space being added. Although there was a decrease in net absorption in 2020, the retail sector rebounded in the following year, leading to a positive annual demand in the Northeast. However, this demand remained relatively modest due to the ongoing impact of store closures. Rental rates are notably budget-friendly, averaging around $14.60 per square foot. Among different types of retail spaces, mall rentals command the highest rates, averaging $22.00 per square foot, which is slightly below the market’s average for mall space.
Investor involvement has been modest, with just under $300 million trading hands since 2018. This amount represents less than 10% of the total deal volume in the market. The retail sector’s rebound in 2021 contributed to a surge in deal volume, with approximately $125 million in transactions. The 12-month sales volume currently stands at $41.6 million.
Northeast by the Numbers Last 12 Months
Source: CoStar Group
- Vacancy Rate: 5.6%
- Rent Growth: 4.0%
- Deliveries SF: 56,000
- Sales Volume: $41.6M
East
Vacancy | Rent | Construction | Sales
The vacancy rate in the East retail submarket currently stands at 7.5%. Over the last 12 months, there has been negative absorption of 9,000 square feet, and no new net deliveries have occurred. The current rental rates are approximately $17.60 per square foot, reflecting a 4.6% rise compared to their level one year ago. Over the past three years, there has been an overall increase of 9.3% in rental rates. There are currently 11,000 square feet under construction, which constitutes a minimal inventory expansion, amounting to just 0.1%.
There has been significant investor activity in the East capital markets, establishing it as one of the most actively traded submarkets in the region for several years. On average, the annual sales volume has been $41.9 million over the last five years, with the highest 12-month total reaching $85.1 million. In the last 12 months, recorded transaction volume in this area amounted to $32.1 million, primarily attributed to the robust performance of the General Retail sector.
East by the Numbers Last 12 Months
Source: CoStar Group
- Vacancy Rate: 7.5%
- Rent Growth: 4.6%
- Sales Volume: $32.1M
Chagrin Corridor
Vacancy | Rent | Construction | Sales
The vacancy rate in the Chagrin Corridor retail submarket is currently at 4.7%, showing a 0.2% decrease over the past year. In this 12-month period, 5,600 square feet of retail space has been taken out of the market, and there has been a negative absorption of 1,700 square feet. When accounting for all available space, including sublease options, the total availability rate stands at 4.9% of the entire inventory. The current rental rates are approximately $26.00 per square foot, indicating a 5.3% rise compared to their level one year ago. There are currently 57,000 square feet under construction, which accounts for a 2.4% increase in the total inventory.
In the Chagrin Corridor, only four sales were recorded in the past year, a typical level of deal activity for this region. The yearly sales volume has averaged $6.2 million over the last five years, with the highest 12-month total reaching $20.1 million. The 12-month sales volume currently stands at $7 million, primarily influenced by activity in the General Retail sector.
Chagrin Corridor by the Numbers Last 12 Months
Source: CoStar Group
- Vacancy Rate: 4.7%
- Rent Growth: 5.3%
- Sales Volume: $7M
Lyndhurst-Landerhaven
Vacancy | Rent | Construction | Sales
The Lyndhurst-Landerhaven retail submarket has a vacancy rate of 10.1%, a significant decrease of 5.7% in the past year. During this 12-month period, 65,000 square feet of retail space has been occupied, and there have been no new additions to the inventory. In this submarket, Neighborhood Centers make up the largest subtype, comprising a total of 610,000 square feet. The current rental rates are approximately $19.20 per square foot, reflecting a 5.4% rise compared to their level one year ago. Over the last three years, there has been an overall cumulative increase of 12.9% in rental rates. There are currently no construction projects in progress.
In Lyndhurst-Landerhaven, only two sales were recorded in the past 12 months, which is consistent with the typical level of deal activity for this area. The annual sales volume has averaged $4.1 million over the last five years, with the highest 12-month total reaching $9.6 million. In the last 12 months, the recorded transaction volume in this area has amounted to $2.3 million.
Lyndhurst-Landerhaven by the Numbers Last 12 Months
Source: CoStar Group
- Vacancy Rate: 10.1%
- Rent Growth: 5.4%
- Sales Volume: $2.3M


